While graph theory applications have been in the market for many years, they are gaining popularity because fraud rings are larger, more complex, and more organized than ever before.
In mathematics, graph theory is the study of graphs that identifies relationships between objects. In financial services fraud detection, these objects are likely to be unique personal identifiers, like an address, phone number, or Social Security number (SSN).
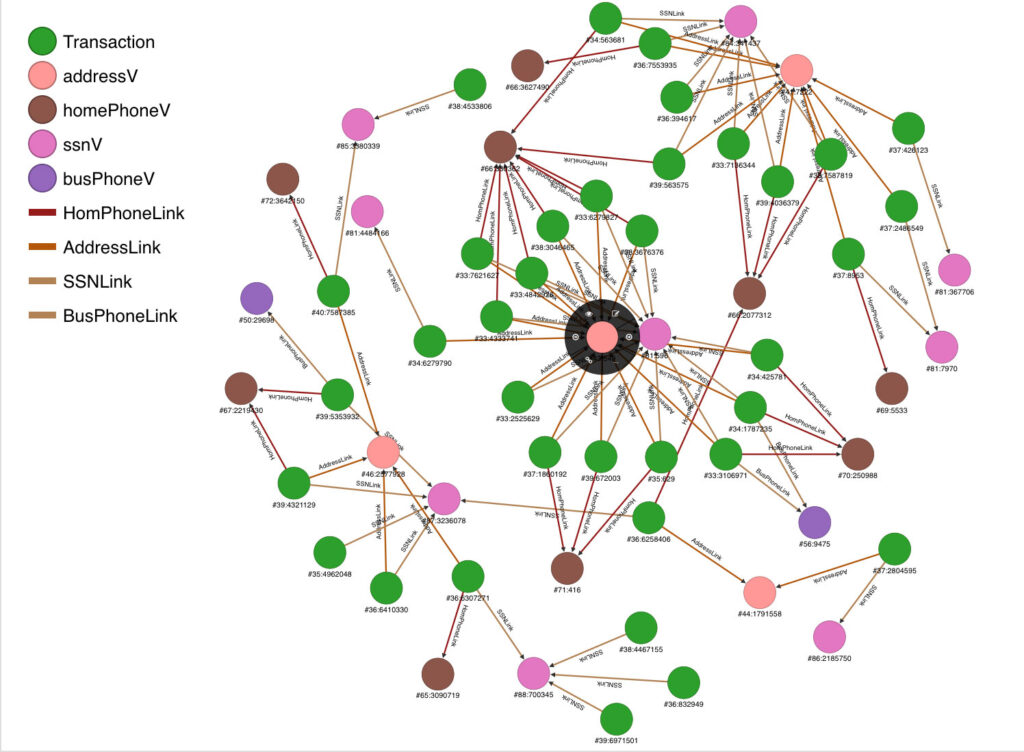
Many fraud investigators will use graph theory visualization to look for additional linkages to suspicious or fraudulent activity. For example, if three new-account applications share the same address but have three different SSNs, the investigator might use graph theory visualization to look for other anomalies related to identity, contact, or transaction information. This linkage is referred to as a “first level” link. That is, we observed the three applications at this first-level address level.
However, let’s suppose that one of these three SSNs was separately linked to four additional applications with this same SSN, and let’s say we saw a phone number for one of those four shared a phone number with three other applications. You now start to see the picture.
In our first example, we saw three applications linked together through a common address. But as you go beyond the first level linking, there are now 10 new-account applications that are all linked through the combinations of address, SSN, and phone number.
These linkages can be displayed graphically using the latest visualization software. The graphs include both vertices and edges. In our example, the vertices would be both the transaction as well as the shared link, such as the common address. The edges would simply be the lines connecting or linking to these vertices.
With visualization software, investigators can more clearly see fraud rings unfolding, and this helps them understand how fraudulent behavior is occurring and how to stop it.
Using Graph Theory Predictively
Most graph theory applications start with a known high-risk transaction or data element and then use graph theory to link to other transactions that share some common element. This “bottom up” approach can be very effective at identifying other potential transactions that may have slipped through.
However, there is another approach. Instead of starting with a single known high-risk element, we take a set of already-connected objects and work backward to find the objects that – when combined – are fraud indicators. (In our example, we would start with the 10 elements linked together.) Using this “top down” approach, you search for and discover what you should identify as high risk. There will be more potential fraud rings that warrant investigation.
The “top down” approach is highly effective when deployed against a vast network of data. For example, if you were seeing 100 percent of all new auto loan applications in the country – in theory – you would be able to identify 100 percent of all fraud rings in auto lending. By linking all this information together in real-time, you can identify high-risk activity and act fast to mitigate it.
Only as Good as the Data
Whether used by investigators for fraud research or by data scientists for predictive modeling, graph theory requires large quantities of high-quality, multi-variate, and time-oriented data. You can have the greatest graph theory software ever designed, but without good data, who cares?
That is why we are so excited to be deploying graph theory technology at Kevari. We have one of the largest new-account application databases, as well as the largest database of account takeover transactions, in financial services. By applying graph theory to these databases, we are allowing our customers to keep more fraud out of the banking system.


